This article is designed to provide you with general information about Reports in Plickers. We also have a specific How-to Guide on using this feature, which you can access through this link.
Before we begin, you can try accessing your Reports by signing in to plickers.com and then selecting Reports from the left-hand sidebar. Or you can view the Reports section within one of your Class homepages.
What are Reports?
The Reports page is one of two tools available for viewing student results within Plickers (the other being the Scoresheet page).
For every content item that you play to your students, you'll be provided with a Report.
Our Reports aim to give you a visual top-level overview of student results, and are presented in terms of content items (like Sets).
For instance, imagine that you play the same Set for a Class twice in one session (like you might do for entry and exit tickets). When you're done, Plickers will create two separate Reports for that Set, allowing you to quickly compare the two performances.
Reports are different to Student Reports. Reports show collated results for a content item, while Student Reports show results for individual students and are accessed via the Scoresheet.
Information included in Reports
Let's say that you play a Set to your students during a Plickers session. Afterwards, the following scores will be available in your Reports page almost immediately:
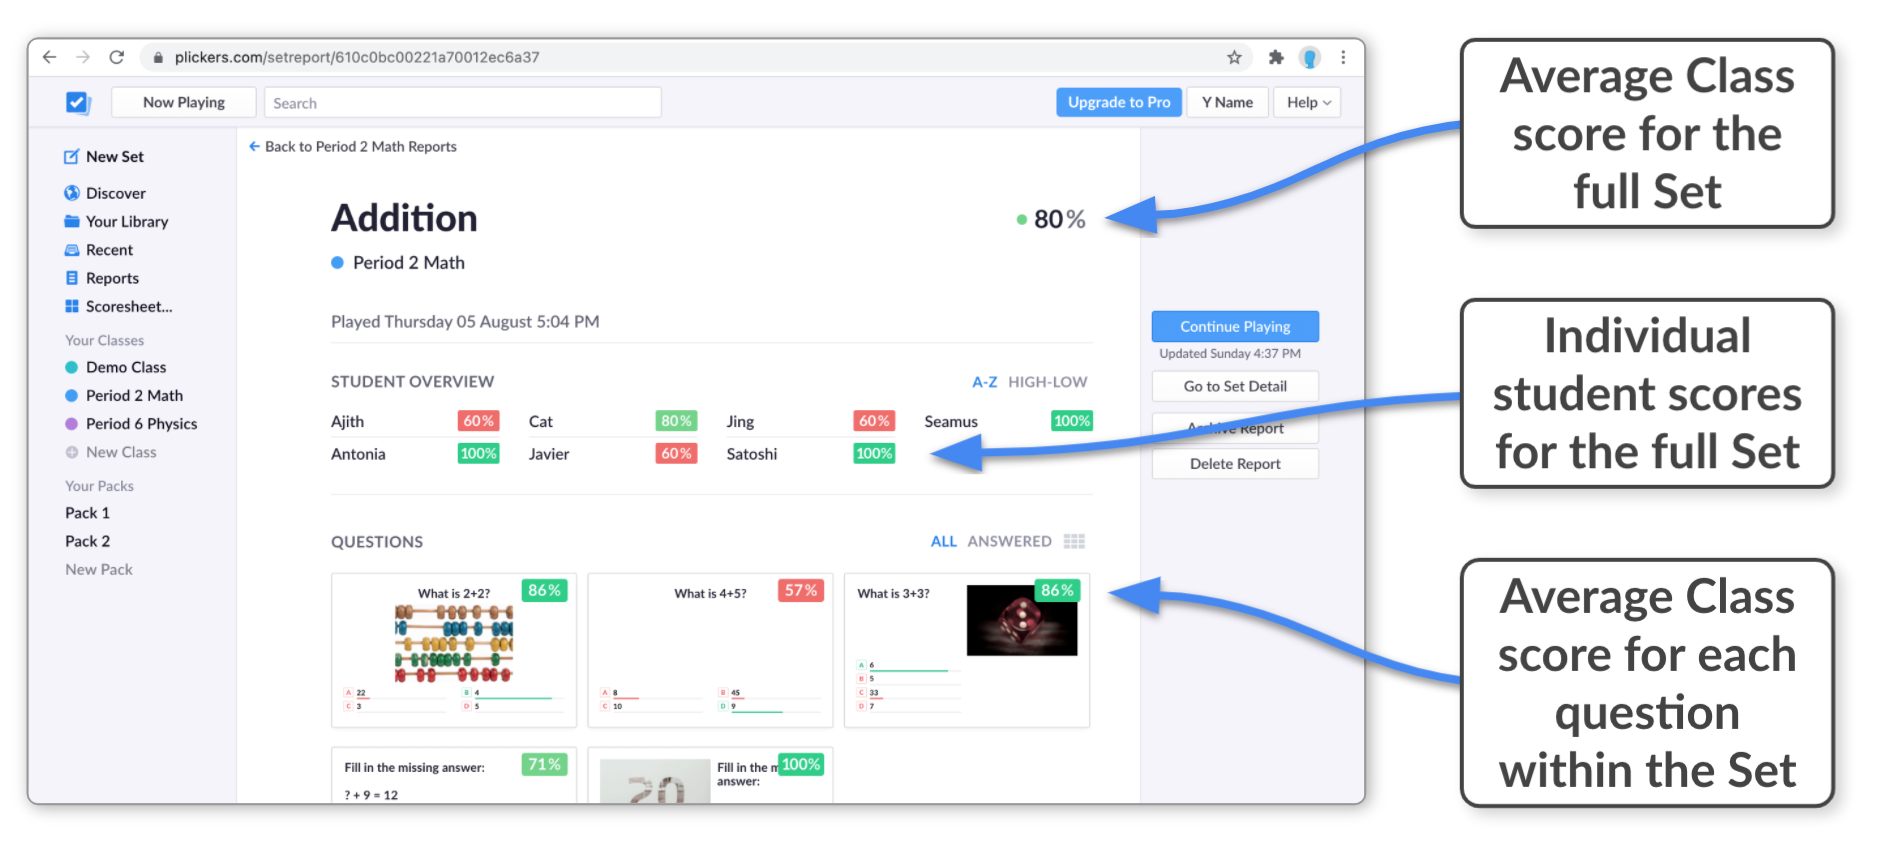
- The average Class score for the full Set
- Individual student scores for the full Set
- The average Class score for each question within a Set
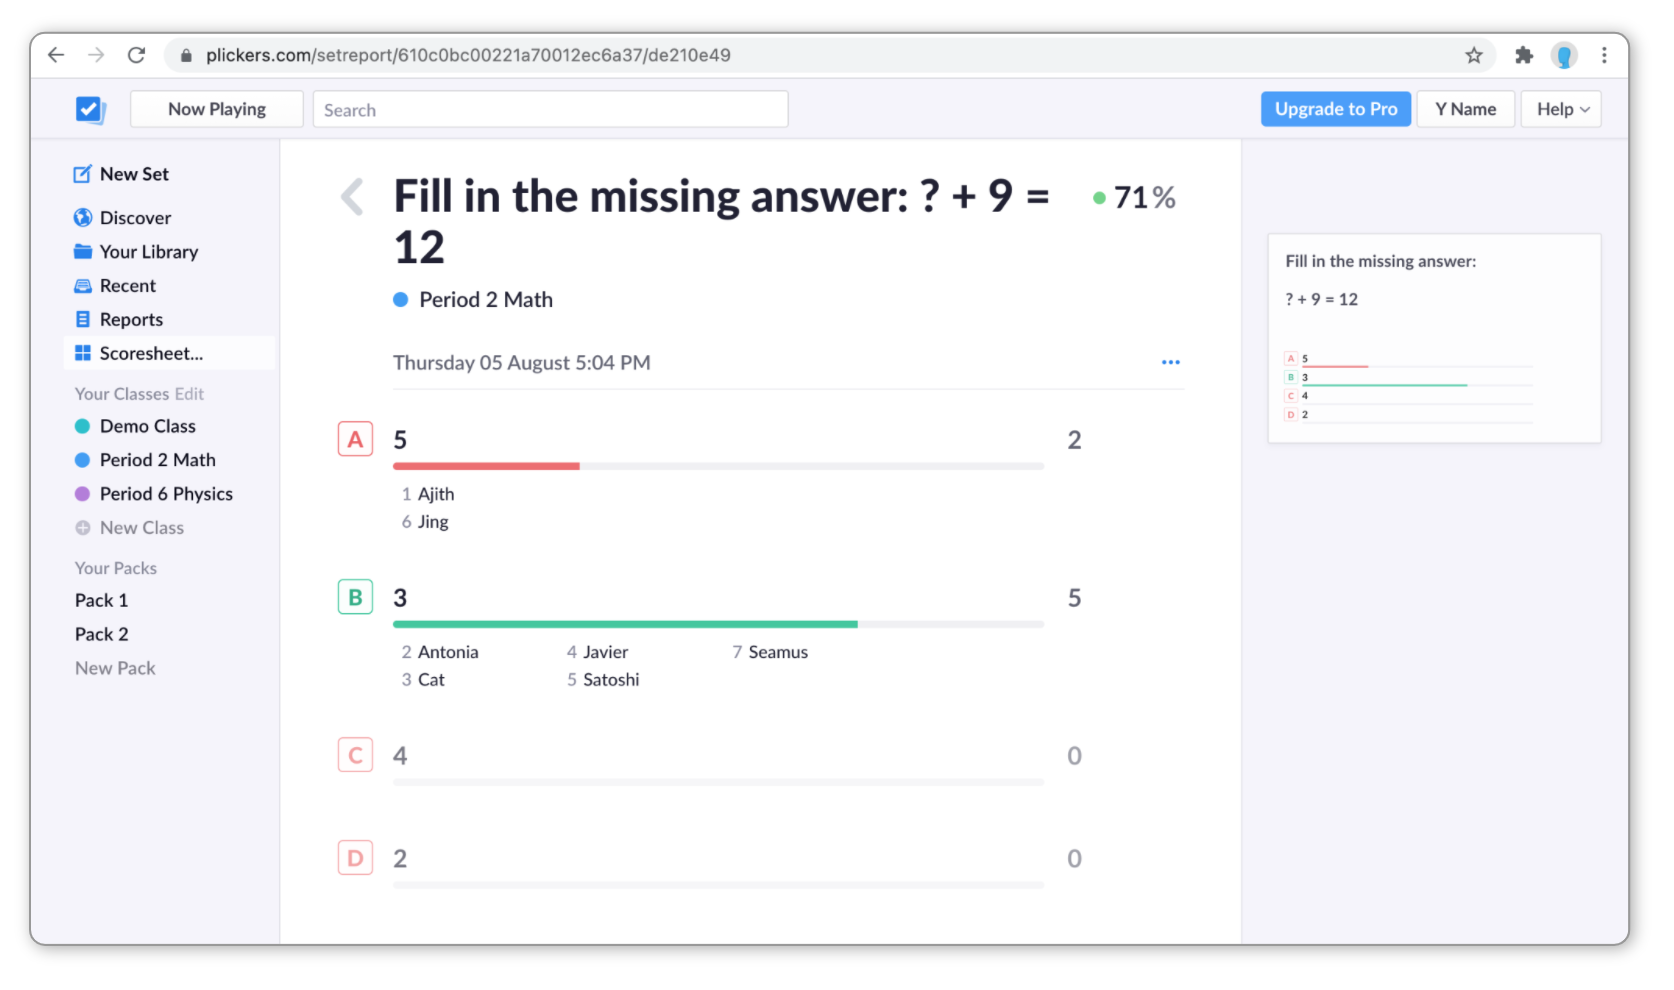
- Individual answers given by students for each question within a Set
The diagram in the next section takes you through where to locate each of these scores within your Report.
What does a Report look like?
To demonstrate, let's assume we've just played a Set called 'Addition' to our Period 2 Math Class and the session is now over. To access the results, we can click on Reports (in the left-hand sidebar of plickers.com) and our most recent Set will be showing at the top of the list.
When we click on our 'Addition' Report, we'll be taken to the page shown below:

And to find individual student answers, we simply need to click on any of the slides located underneath the Questions heading. We'll then see the following page:

To hide or reveal student names in the chart above, simply click anywhere on the graph. Or you can use the 3-dot menu icon to change the default display.
You'll notice that each percentage score is associated with a certain color (particularly so in the top image above). This makes it easier to determine student performance at a glance.
For details on the meaning of each color, click on this link and select the relevant FAQ toggle box under the Student Results heading.
Customizing a Report
There are three ways you can customize a Report:
-
To the right of the Student Overview section, select either A-Z or High-Low, to sort your students alphabetically or by their total score.
-
It may be the case that there is a question in your Set that was (accidentally or intentionally) skipped. If that's the case, you can choose to remove the unanswered questions from consideration by selecting Answered (located to the right of the Questions heading).
-
To the right of the Questions heading, you'll see a grid icon
 . By clicking on this button, you can alter the size of the question slides in the grid to suit your preference.
We hope the information above has been useful for you. As a quick reminder, we also go into detail about how to access your Reports in our How-to Guide linked here.
And if you have any questions that haven't been covered here, please don't hesitate to drop us an email at support@plickers.com, and we'll be more than happy to help out.
Comments
0 comments
Article is closed for comments.